
IMPROVE YOUR CODING.
IT'S 100% AUTOMATIC.
SIGN UP FOR FREE
Codealike remembers everything you do on the code, so you don't have to. It integrates to your IDE and browser while automatically tracks and analyzes your activity.
Codealike is more than a simple time tracker..
There's a plugin for that!
Codealike works for several IDEs so you can understand how you code.
We also have a plugin for Google Chrome so you can track how you browse and debug the web.
Visual Studio
Chrome
IntelliJ IDEA
VS Code
Eclipse
Android Studio
PhpStorm
Atom
RubyMine
PyCharm
WebStorm
Rider
AppCode
CLion
GoLand
DataGrip
Code
has a story to tell.
Learn what you can accomplish through Codealike
How it works?
Codealike is a service that tracks your activity while you code. Once you've installed and signed in on your preferred IDE, the plugin will track, process, and send the data to our servers. This way, you can visualize data anytime to understand how you work and learn how to improve that work through trustworthy data. Happy coding!
2
CODE NORMALLY
For about half an hour
3
SIGN IN HERE
And see your own metrics
Gain visibility.
Enhance productivity.
Personal Performance
With this set of features, you'll be able to discover the way you code, gain visibility and improve through deep understanding of your coding patterns.
Personal Dashboard
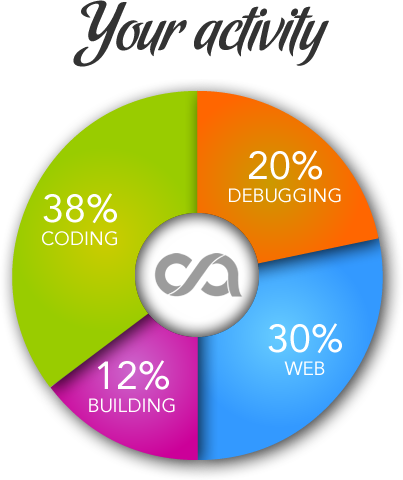
Shows the aggregate information on how your coding time was used (Coding, Debugging, Building and System time) over an specific timeframe. It also lets you quickly see when you've been coding.
Behavior report
Helps you understand how you code day by day. It also shows you how intense is your coding when using different computers.
Web Navigation
Track your coding-related web navigation and web debugging activity by using Codealike's Chrome extension.
Pivot table
PREMIUM FEATUREUse a web-based view similar to a pivot table to model your own data and find meaningful insights from your activity.
Focus & Interruptions
PREMIUM FEATUREDo you want to understand how your concentration grows and how interruptions affect it? This is the feature for you. Codealike shows you your "Focus Curve" but it also shows you how many interruptions you had during different periods of time. This is handy to show clearly how much effort it takes to recover from undesired interruptions.
Code Tree
Shows you the amount of time you spend Editing, Reading, Debugging and Building on different code solutions and projects. But why should we stop there? You'll be able to drilldown all the way through Namespaces, Files, Classes, Methods and Members. Use this report to see code's contributors and technical debt.
Code report
It helps you understand how much time you spend using different technologies. Have you ever wondered what are the 5 files that your attention the most? Well, wonder no more...
Timeline
This feature shows you the ADN of your work. It rebuilds your day by showing you the precise sequence of activity that you did so you can drilldown and explore every segment of time to understand what you did.
Your Facts
Come on! Let's show off! Use "Your Facts" to show the community how you perform. Let them see how many times you were On Fire and what are your favorite technologies.
Download Data
PREMIUM FEATUREWant to go further? Download your activity and explore it in your own way. Create your own data representation using Excel. Find custom insights while analyzing your and your teams' data.
Team Performance
Maybe you don't have the luck to be alone in this wonderful world of coding. If so, we can help you understand how your team works and how it can improve.
Teams Dashboard
Shows the aggregate information on how your team's coding time was used over different pre-determined timeframes. Use this feature to understand how your team apply effort to projects.
Team Member Reports
PREMIUM FEATUREIt lets you see your colleagues activity for the projects that you have in common. Understand how your co-workers perform and how you can improve together. To use this feature you and your colleague must be Premium users.
Comparison
In order to improve your coding, you'll want to see where you stand. Use these features to understand how you compare with Codealike's community and your colleagues.
Ranking
We cannot tell who is the best software developer in the world (yet), but we can tell you who is the most focused and a few other things. Learn what is your position in the weekly Codealike ranking.
Compare
PREMIUM FEATUREMirror, mirror on the wall who's the most efficient coder of them all? Use this feature to understand how you compare to other coders with the Key Performance Indicators and improve your coding.
Pricing
A lot of features for free.
A lot of value in turning Premium.
Basic
- $0/lifetime
Unveils you and your team’s performance.
- Sign Up Now!
- Personal & team reports
- Timeline reports
- Dashboard showing main metrics
- Your facts and achievements
- Partial ranking
Premium
- $12/month
See your Focus and Interruptions.
- Buy Now!
- See your Focus level and interruptions (And show it to your boss :-)
- Analyze how you spend your time In-The-Zone
- Personal & team reports
- Timeline reports
- Detailed report on your activity across the web
- Download your data
- Compare your current behavior with your track record
- Compare yourself with your team and the community
- View your focus curve and interruptions
- Compare your focus with the community
Premium
- $99/year
Pay less.
- Buy Now!
- All Premium features for a whole year
- 30% discount